Visualizing Building-Related Data
November 7, 2016Do you ever feel like you’re designing in the dark sometimes? You know what you’re doing but at all the stops along the way you either find yourself fact checking, re-crunching numbers or just plain didn’t see the impact one area of your work was having on another? While a typical leader might glean you some of their wisdom and point you to what they call “insight” to help you through that step. In a closed process its actually referred to as the inevitable. The predictable – and that’s a really good thing. Predictability is something we can account for in our process and in many cases not only automate it, but automate past it when it arrives.
What does it take to put them into practice?
Knowing is half the battle. Asking better questions will help you re-frame the question, “Are we able to do this, this and this?” To asking “how can this insight help solve the problem?” After all, a major component of architecture is problem solving. With that being said I take us on a journey about tasks and supertasks. The term “super-task” itself was coined by J.F. Thomson (1954).2
A supertask is a task that consists in infinitely many component steps, but which in some sense is completed in a finite amount of time. (See Zeno’s paradox) If this sounds a bit like architecture and building design, I assure you the concept is the same. Rather than dealing with perspectives of quantum mechanics or general relativity; architects, engineers and designers are all after the many solutions to varying problems with varying degrees of complexity.
Think for a moment all the tasks an architect or engineer must go through just in the design phase. Let’s focus on just form finding and functional placement of spaces. Data from the previous phase, “Programming” must be translated and manifest itself into something physical at some point. We use digital tools to help speed this process, but not aide the process. How many of these tasks are giving visual feedback to the person crafting the project?
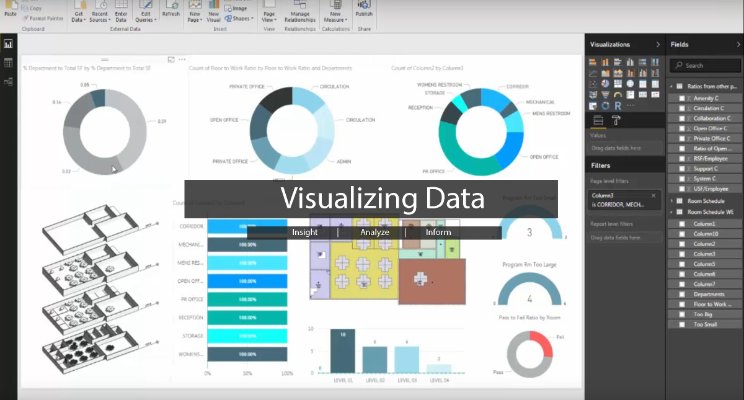
In the video below, I take us through a visual depiction of just a few things I look for in a project such as: am I over or under on program square footage, which rooms am I accounting for, what levels contain the most program spaces, how does that compare to other projects I’ve done as well and finally how do all those spaces inter-relate to themselves?
Without a visual description of this happening, it leaves the project with a couple choices.
- Go forward as normal and accept the outcome.
- Spend time manually calculating things out.
- Constantly asking for help or comments.
Would you rather see what is going on in the project or go about the process as usual? If you’re interested in how you store, access and analyze your data, then you’re willing to take that next evolutionary step towards better design through increased collaboration, new techniques and time for reflection. Future designers will need all three if they are to create a better world.
When we illuminate data, we’re talking about a direction that we can understand it and better relate to it. If we uncover hidden patterns in both human uses and building optimizations then we can better understand how to design the spaces we occupy. How are you simplifying your data analysis for your projects?